What is MRI?

Magnetic Resonance Imaging (MRI) is a non-invasive method for visualizing and evaluating structures in the body. At the CCBBI we use MRI to study brain functioning and behavior, this field of research is called cognitive neuroscience. CCBBI is dedicated to the study of brain mechanisms underlying individuals’ cognitive capacity and subjective well-being, as well as dysfunctions of these brain mechanisms with normal aging and mental disorders. For more information about ongoing research, check out CCBBI Research Groups.
Structural MRI
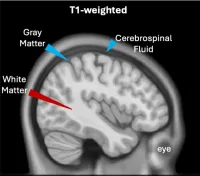
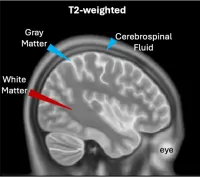
Structural MRI is used to visualize and measure the 3D anatomy of the human brain. The MRI signal used to produce structural images is sensitive to the amount of water in different types of tissue. Tissues with high signal appear bright white, while areas with low signal appear dark. There are different kinds of structural MRI images, at the CCBBI we commonly collect T1-weighted and T2-weighted images.
Functional MRI?
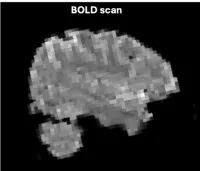
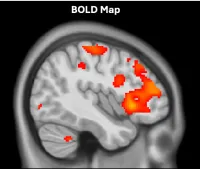
Functional MRI (fMRI) is used to measure brain activity. The signal used to produce fMRI images is the blood oxygen level dependent (BOLD) signal. When your brain is active, it uses oxygen, which changes the ratio of oxygenated and de-oxygenated hemoglobin in the blood, which changes the BOLD signal. These changes allow researchers to identify specific areas of activity and help us to understand brain functions and processes.
fMRI scans show what the brain is doing in real time.
During an fMRI study, research participants are often presented with stimuli or asked to perform tasks while being scanned. The fMRI records participants’ neural activity, which researchers can later analyze to identify areas of activity in response to study-specific stimuli or tasks. A common analysis method is to produce statistical parametric maps where different colors reflect the probability that an area of the brain is active during a task.